
Create and View Spoil Reports
In this article
Permissions
All users can access the All Reports page (Menu > All Reports) and view spoil reports that they create, spoil reports shared with them by other users, and spoil reports that have been configured as public. All users can also edit their own spoil reports, but not those created by other users.
Note: To edit spoil reports owned by other users, you must have Spoil Admin permissions. Users with these permissions can edit material types, suppliers, load and disposal sites, and bulk edit spoil data by importing Excel spreadsheets.
These users can also manually add load entries, and merge and unmerge spoil movements. Read the Edit a Spoil Report help article for more information.
Create a New Spoil Report
To create a new spoil report:
- Sign in to Virtual Superintendent.
- Click Menu > All Reports. The All Reports page opens.
- Click Create New Report. The Create New Report panel opens.
- Click Spoil. The Spoil - New Report page opens.
- Click the Clock icon in the upper-right corner. The date range selector opens.
- Choose a report date range. The report updates.
- Use the filters on the left side of the page to refine the report data. The report updates to display only matching spoil movements.
Note: By default, a new spoil report displays data from the previous 30 days.
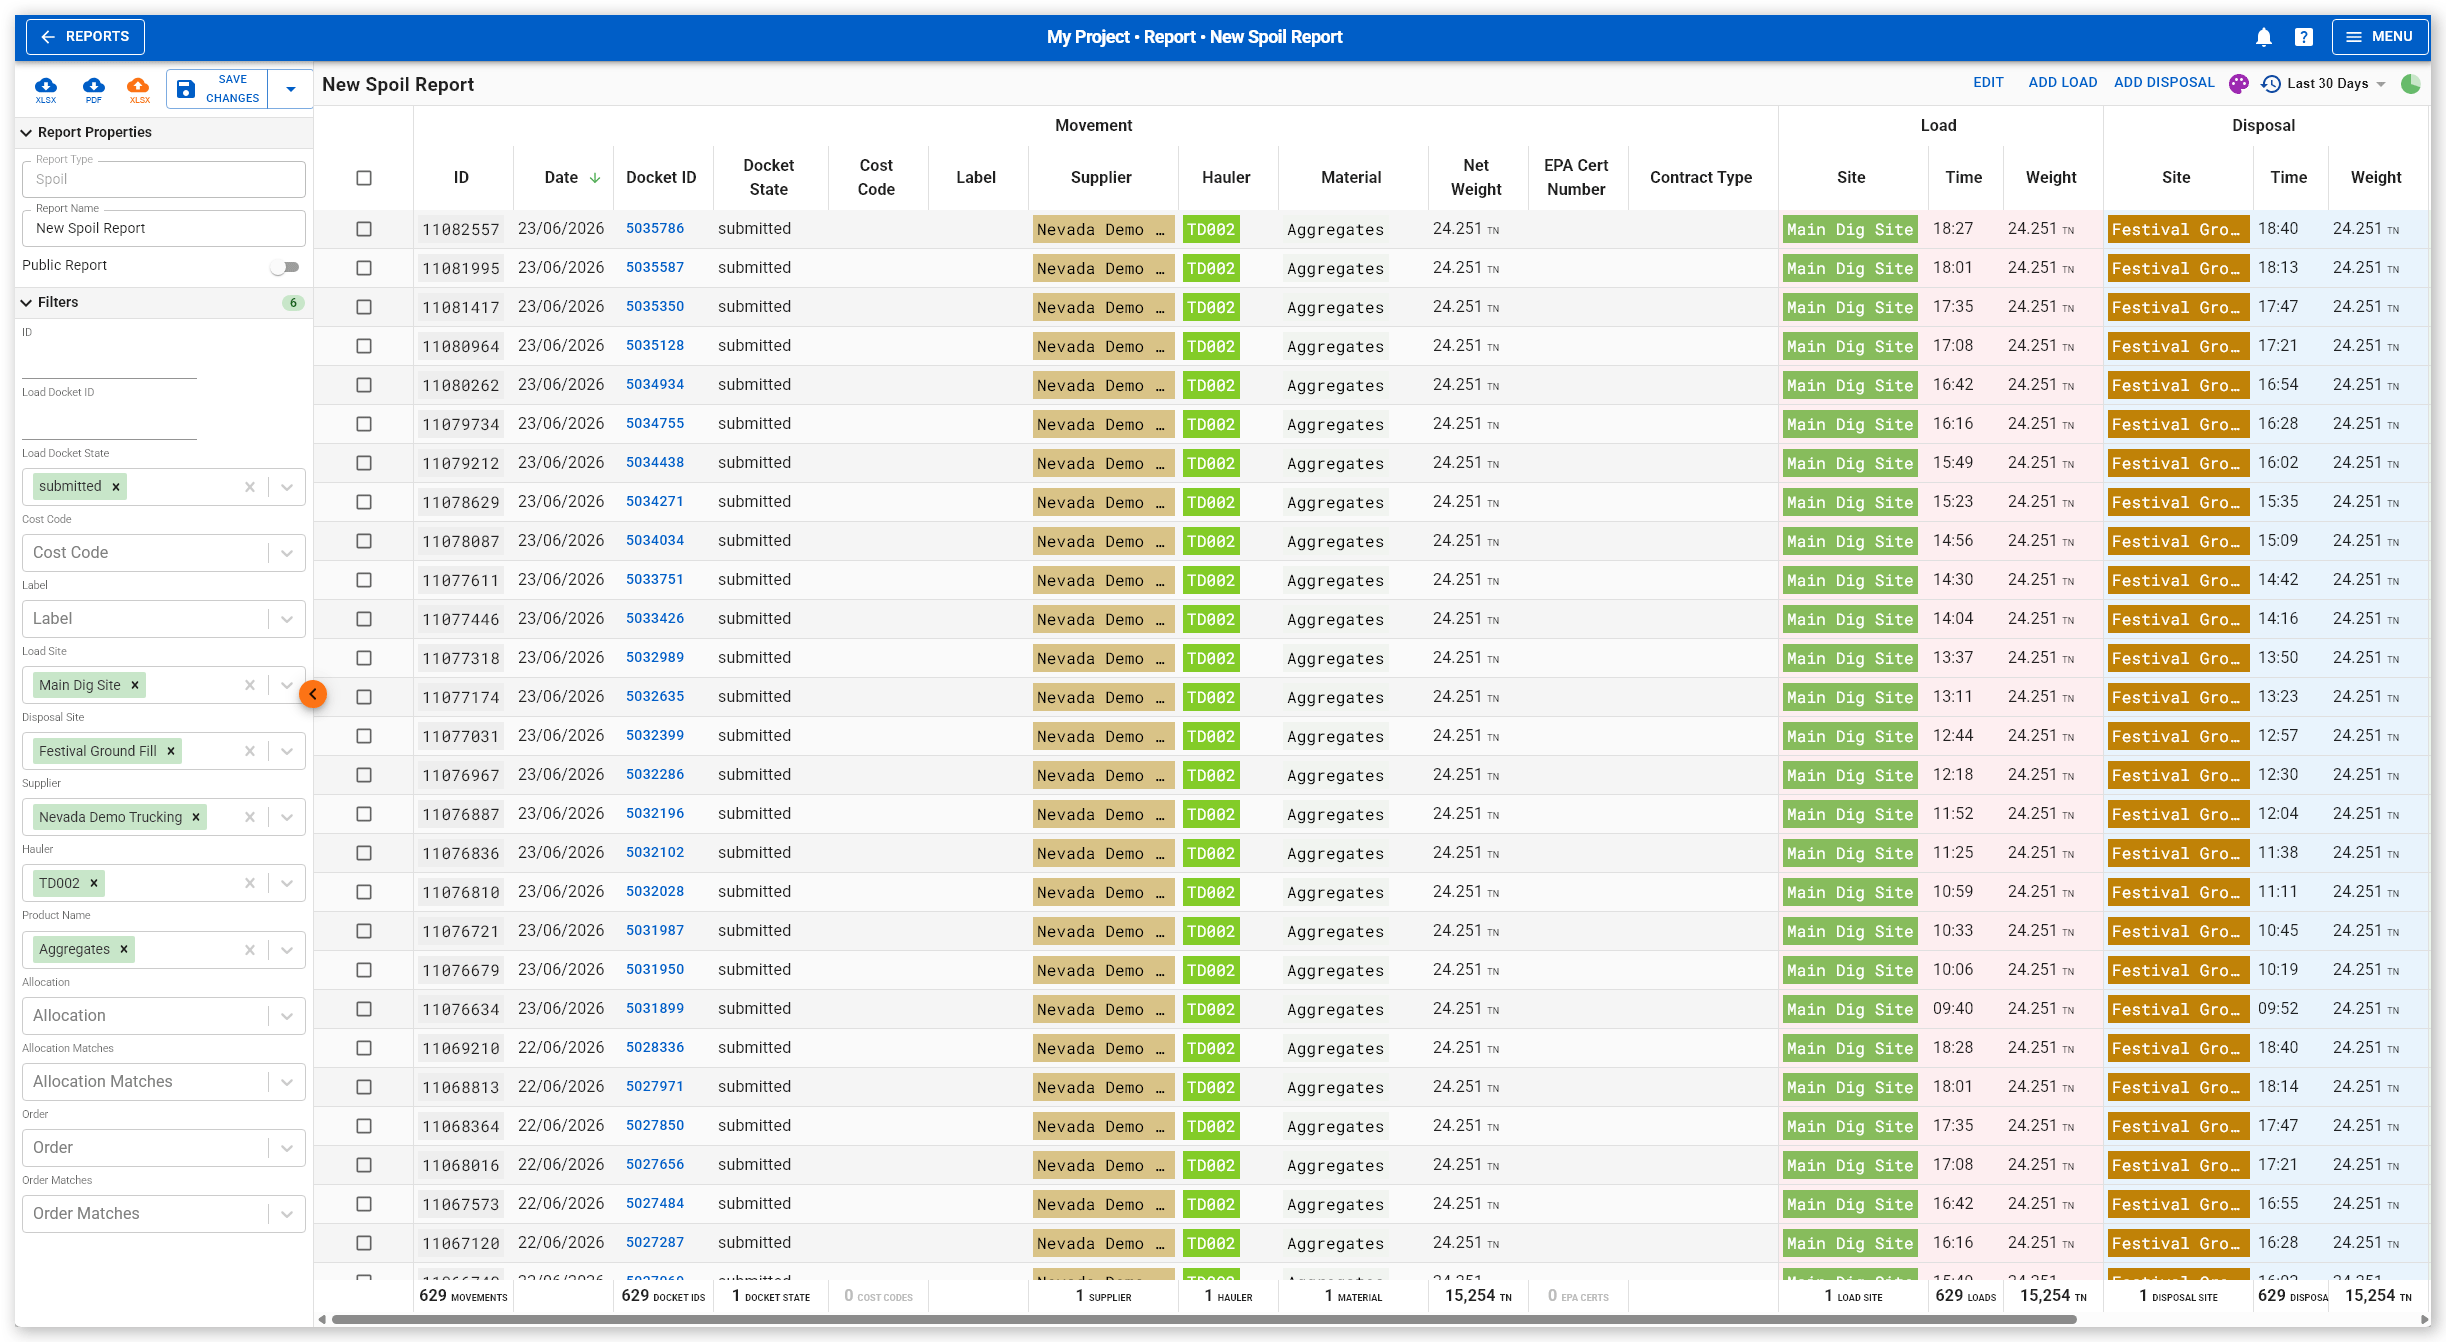
Each row in the report represents a single spoil movement of material from a load site to a dump site using data generated from several sources, including:
- Load information from fixed weighbridges (created using integrations), virtual weighbridge (VWB) dockets, driver-created dockets, gatekeeper-created dockets, and manually recorded load details entered by users with Spoil Admin permissions.
- Disposal information from driver-created dockets, fixed weighbridge dockets (created using integrations), and manually recorded load details entered by users with Spoil Admin permissions.
The data from these sources is compiled by Virtual Superintendent, calculated using data priority rules, and then displayed under the following report columns:
Movement
| Column | Description |
| ID | Unique 8-digit spoil movement ID (ticket number) |
| Date | Date the spoil movement was started |
| Docket ID | ID of the weighbridge docket automatically created for this spoil movement |
| Docket State | Status of the movement's weighbridge docket |
| Cost Code | Cost code of the movement |
| Label | Labels applied to the docket |
| Supplier | The name of the supplier carrying out the spoil movement |
| Hauler | The name of the truck used for the movement |
| Material | The type of material being transported |
| Net Weight | The weight of the material loaded |
| EPA Cert Number | The EPA certification number of the hauler |
| Contract Type | The contract type used with the supplier |
Load
| Column | Description |
| Site | The name of the loading site |
| Time | The time the hauler arrived at the loading site |
| Weight | The weight loaded on the hauler |
Disposal
| Column | Description |
| Site | The name of the disposal site |
| Time | The time the hauler arrived at the disposal site |
| Weight | The weight dumped by the hauler |
Allocation
| Column | Description |
| ID | Unique ID of the allocation that this movement belongs to |
| Matches | Whether the movement fully matches the allocation rules (date, time and hauler truck data exactly match or not) |
Note: For more information about how transport supplier allocations work with spoil movements, see The Allocations Page help article.
Order
| Column | Description |
| ID | Unique ID of the order that this movement belongs to |
| Matches | Whether the movement fully matches the order requirements |
Manage column visibility
To show or hide columns you aren't interested in:
- Hover your mouse over a column group heading then click the three-dot menu. A contextual menu opens.
-
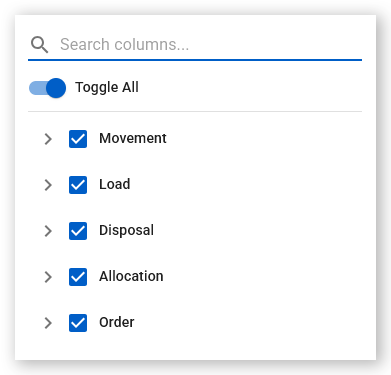
Click Manage Columns. The column selection dialog opens.
 Click or tap to expand image
 -
Toggle on or off individual columns.
 Click or tap to expand image
To hide individual columns:
- Hover your mouse over a column heading then click the three-dot menu. A contextual menu opens.
-
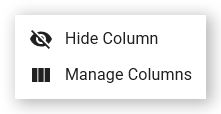
Click Hide Column. The column is removed from the report.
 Click or tap to expand image
View individual spoil movement details
To view spoil movement details for individual hauler vehicles on a given day:
- Sign in to Virtual Superintendent.
- Click Menu > All Reports. The All Reports page opens.
- Open an existing spoil report or create a new spoil report.
- Click a movement row in the report. The Spoil Movement Details dialog opens.
- Select a checkbox beside a movement. The bottom of the dialog updates, showing information about the selected movement and other movements by the hauler vehicle on that day.
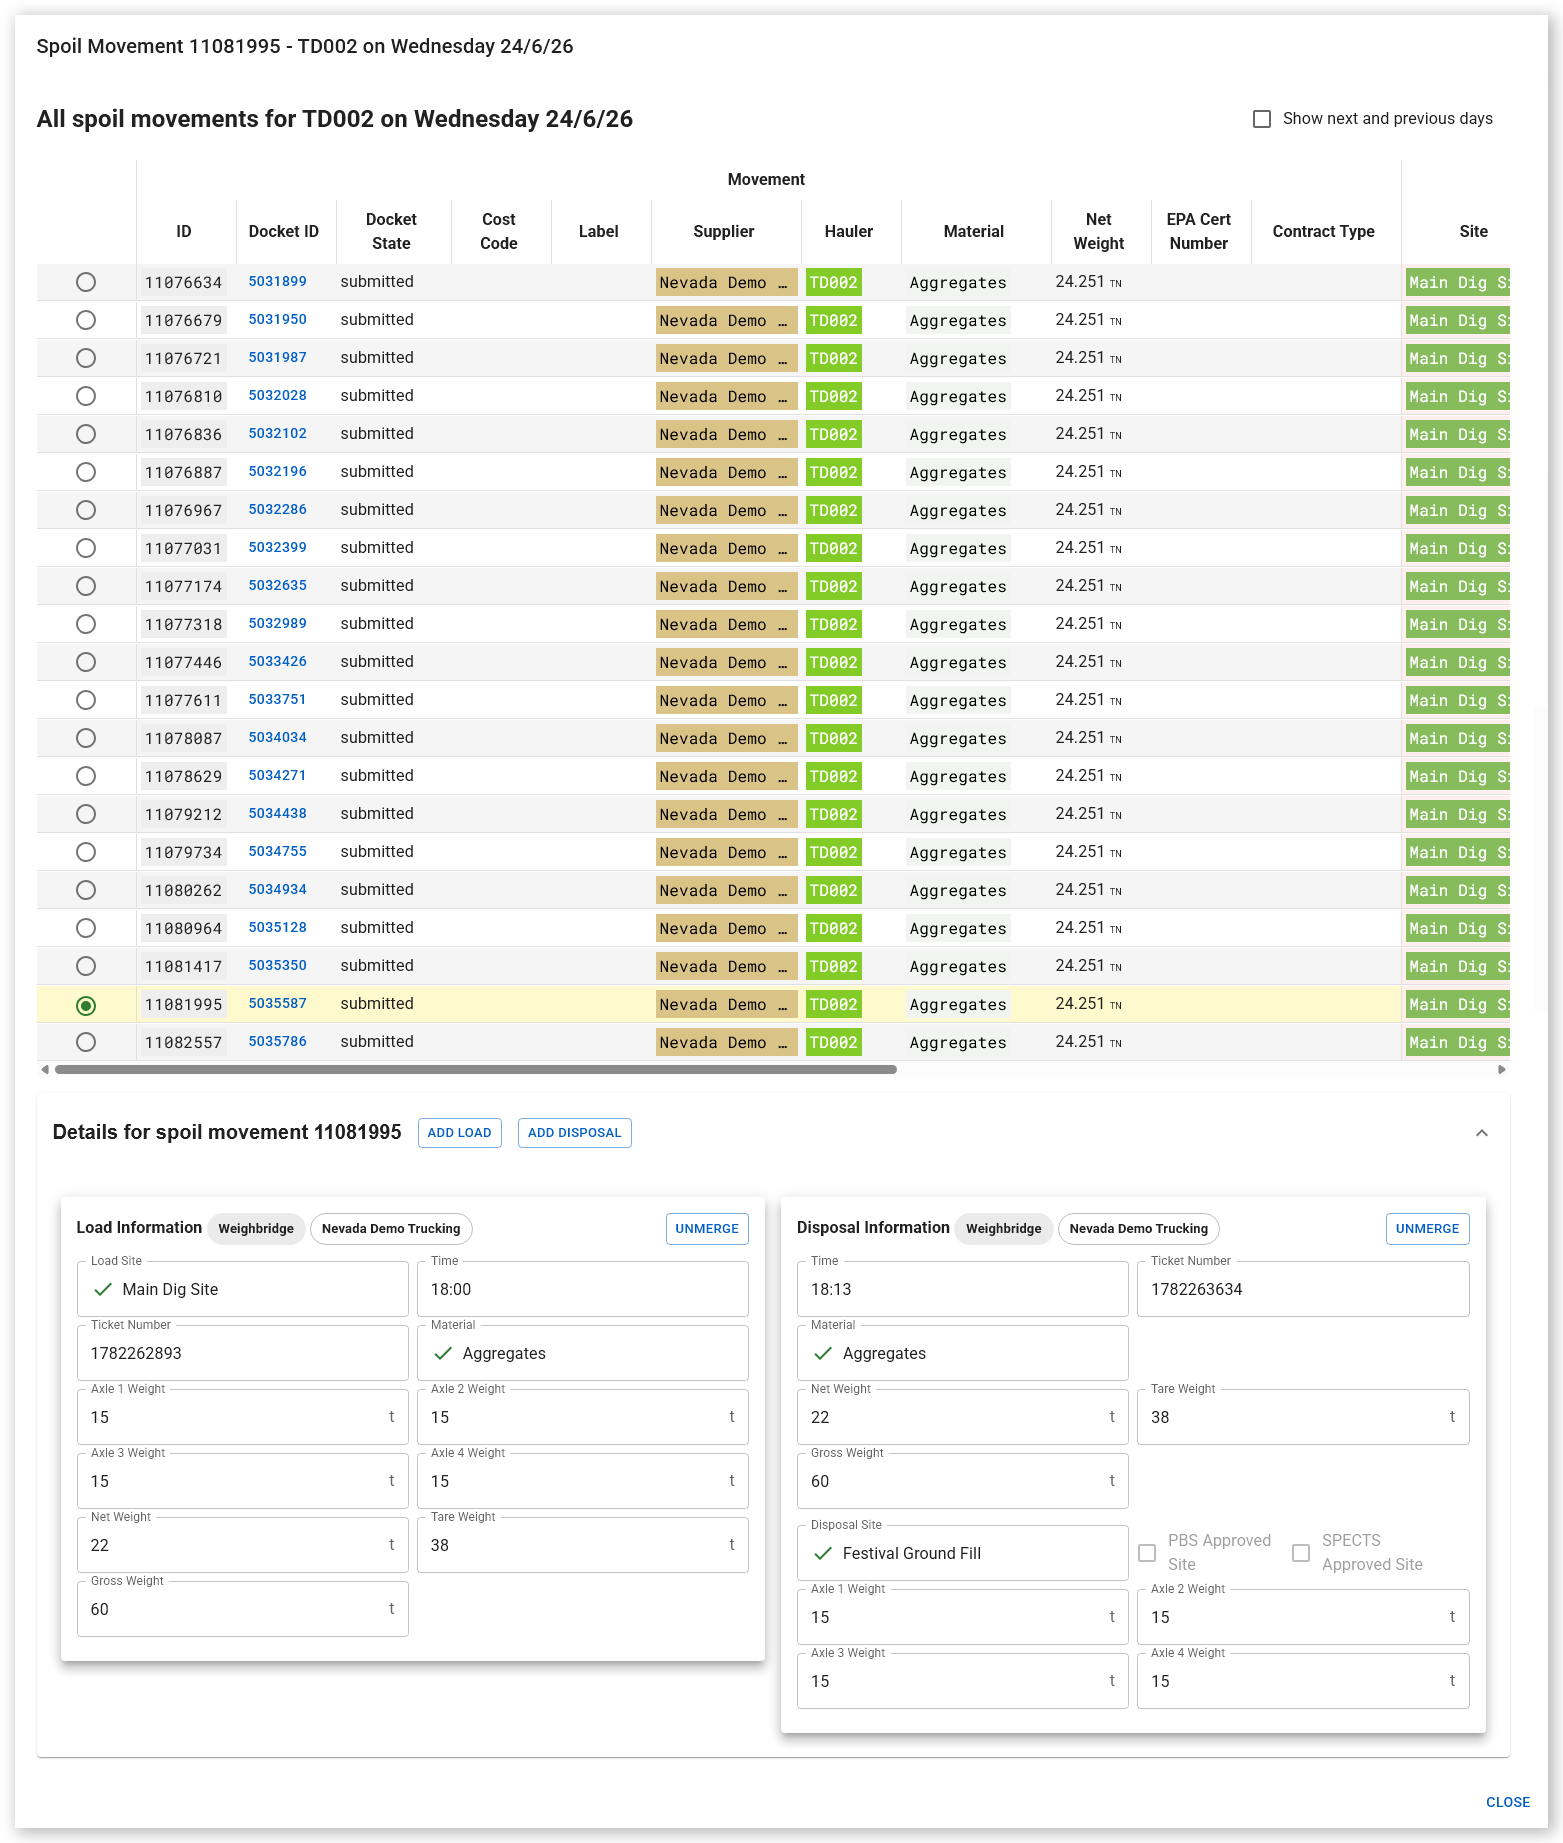
The page displays:
- All spoil movements completed by the truck on the selected day at the top of the dialog. Each row represents a single movement.
- Edits made to the spoil movement by Spoil Admin users in a panel below the movements list (only shown if edits have been made).
- Load information for the selected movement in a panel at the bottom-left of the dialog. Change the movement shown in this panel by selecting a checkbox beside another movement in the upper movements list.
- Disposal information for the selected movement at the bottom-right of the dialog. Change the movement shown in this panel by selecting a checkbox beside another movement in the upper movements list.
- A Show next and previous days checkbox in the upper-right corner. Select this to update the report dialog to also show information about spoil movements from the day before and after the selected date (showing a total of three days of information).
If a spoil movement contains multiple load or disposal entries for a single spoil movement, all entries are displayed.
Note: You can also manually merge spoil movements together here by clicking the Merge button in the far-right column, merging the current movement (the movement detailed at the bottom of the dialog) with the selected movement (the movement row in which you clicked the Merge button).
If movements have already been merged, you can unmerge their load and unload details using the Unmerge buttons in the lower Load information and Disposal information panels.
Data priority rules
When multiple data sources provide load and disposal information about the same movement, Virtual Superintendent uses priority rules to decide which of the conflicting values is shown in the spoil report.
When competing values exist and Virtual Superintendent has chosen a "winner", this is indicated with a green tick.
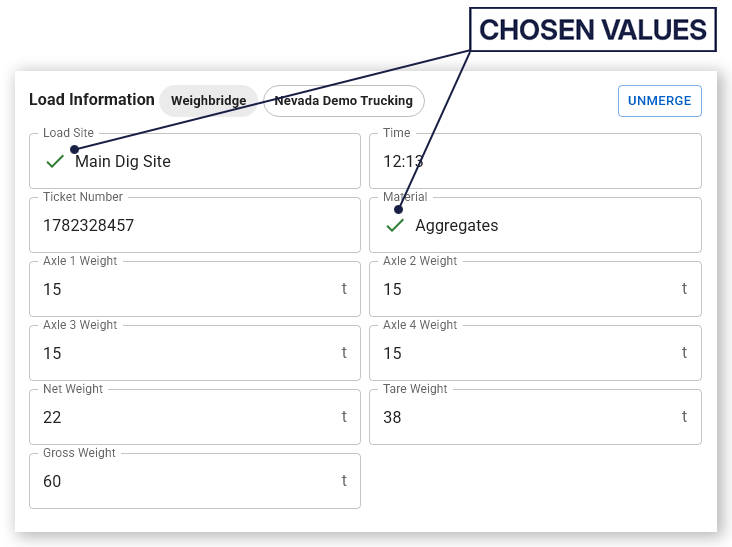
Load information typically prioritizes:
- Load site
- Material type
- Load time
Disposal information typically prioritizes:
- Disposal site
- Disposal time
- Weight
Where duplicate information exists, the most recent entry typically takes priority.
Note: These prioritization rules can be customized to meet your project-specific requirements. These changes must be configured by the Virtual Superintendent support team.
View weighbridge dockets
Virtual Superintendent automatically generates a weighbridge docket for each spoil movement. These are shown under the Docket ID column in spoil reports.
To open a weighbridge docket:
- Sign in to Virtual Superintendent.
- Click Menu > All Reports. The All Reports page opens.
- Open an existing spoil report or create a new spoil report.
- Select a docket link under the Docket ID column. The weighbridge docket opens.
Depending on the docket type, you can:
- Assign an engineer. Typically, these dockets are automatically assigned to a default supervisor set by Virtual Superintendent support in coordination with your project management team.
- Apply cost codes
- Review attachments
Note: For large numbers of dockets, use the Dockets pages to review, approve, and process dockets in bulk.
Report Settings and Filters
This section explains what filter options are available in reports, how to set a report date range, and how to toggle the color coding of rows on or off.
Using the report filters
Use the filter and settings panel on the left side of the report to name, configure, save and download a report and to control the data it contains.
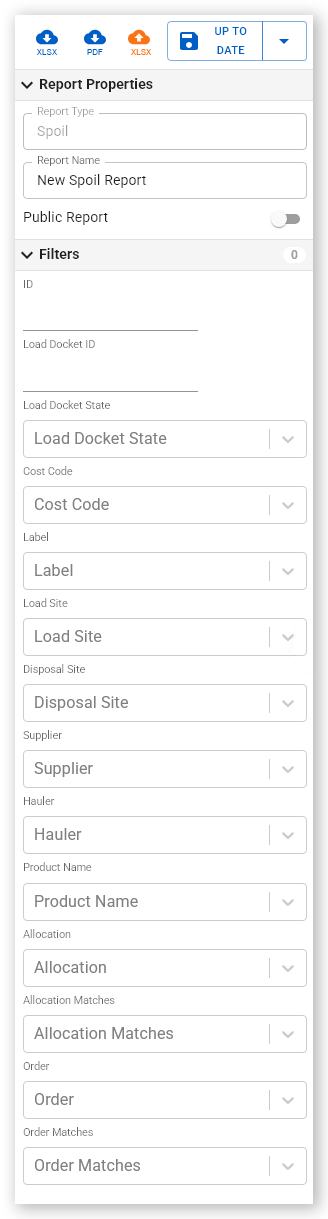
Report settings
| Setting | Description |
| Download Report | Downloads report data as a PDF or XLSX file |
| Save Changes | Saves the report and current filter settings |
| Save As | Saves a copy of the report with the current filter settings |
| Discard Changes | Reverts the report configuration to its last saved state |
| Report Type | Specifies the report type (Spoil). Read-only. |
| Report Name | Specifies the report name |
| Public Report | Controls whether the report is public (on) or private (off) |
Filter settings
The report supports the following filters:
| Filter | Description |
| ID | Unique 8-digit spoil movement ID (ticket number) |
| Load Docket ID | Unique ID of the weighbridge docket |
| Load Docket State | The status of the weighbridge docket |
| Cost Code | Cost code of the movement |
| Label | Labels applied to the docket |
| Load Site | The name of the loading site |
| Disposal Site | The name of the disposal site |
| Supplier | The supplier carrying out the movement |
| Hauler | The name of the truck used for the movement |
| Product Name | The name of the material being transported |
| Allocation | Unique ID of the allocation that this movement belongs to |
| Allocation Matches | Whether the movement fully matches the allocation rules (date, time and hauler truck data exactly match or not) |
| Order | Unique ID of the order that this movement belongs to |
| Order Matches | Whether the movement fully matches the order requirements |
Report updates
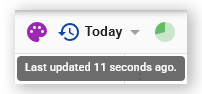
The update icon (a green animated circle) in the upper-right corner of the report indicates when the data shown was last refreshed. Hover over the icon to view the exact update time.
Set the Report Date Range
Spoil reports support relative and absolute date ranges.
Relative date ranges
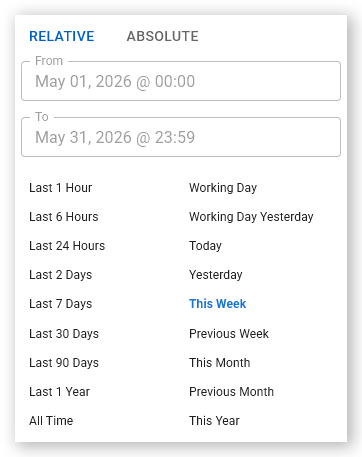
Relative reports are based on timeframe relative to the current date and time. Use relative date ranges for reports that you view regularly.
To set a relative date range:
-
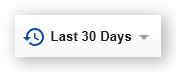
Click the current date range in the upper-tight corner. The date range selector panel opens.
 Click or tap to expand image
 -
Click Relative.
 Click or tap to expand image
 - Select a predefined date range. Examples include Today, This Week and the current Working Day.
Absolute date ranges
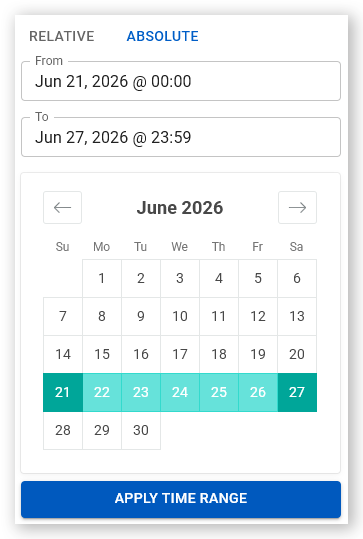
Use absolute date ranges for reports covering a specific period.
To set an absolute date range:
-
Click the current date range in the upper-tight corner. The date range selector panel opens.
Click or tap to expand image -
Click Absolute.
 Click or tap to expand image
 - Select a start date and end date on the calendar.
- Click Apply Time Range. The report updates.
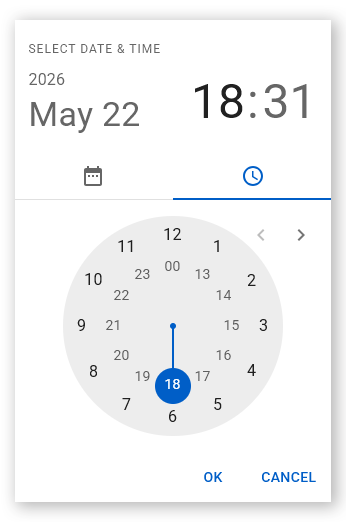
To specify a time range:
- Select the From or To time field. The Select Time & Date dialog opens.
-
Select the required time.
 Click or tap to expand image
 - Click OK. The report displays data only for the selected date and time range.
Enable color coding
Color coding links chart data with the corresponding report rows.
To toggle color coding on or off:
-
Click the palette icon. The report and charts display matching colors for related data.
 Click or tap to expand image
Export Spoil Report Data
You can export spoil report data as Excel files and PDF files.
Export to Excel
To export an Excel file:
- Apply any required filters.
- Click the Download XLSX button. The Excel file downloads to your computer.
Users with Spoil Admin permissions can update supported fields in the exported template and upload it using the Upload XLSX button to perform bulk edits.
Export to PDF
To export PDF files:
- Select the columns you want to include.
- Click the PDF icon. The Processing Tasks dialog opens and begins the PDF generation process. When this process is completed, the PDF files are downloaded as a ZIP archive.
Note: Each spoil movement generates a separate PDF file. As a result, the PDF generation process might take some time.